

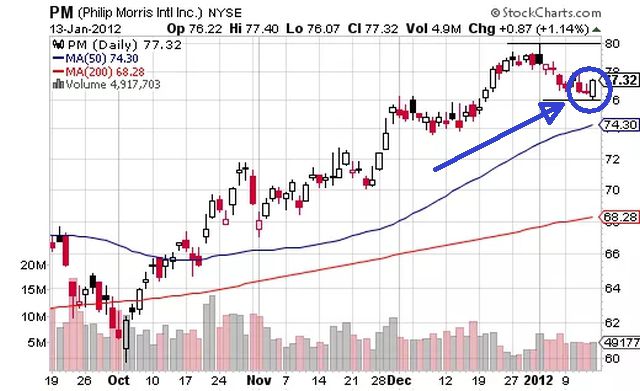
Timing is important in the world of trading, and getting it right can have a huge impact on your profits and losses. While it is impossible to time the market perfectly, many traders use price action to get a sense of whether buying or selling pressure is increasing.
Among the many candlestick patterns, two of the most useful patterns are bullish engulfing and bearish engulfing. These patterns provide valuable insights into how market sentiment is changing.
In this article, we will take a closer look at bullish and bearish engulfing patterns: what they are, how to spot them, and what they can tell us about the market’s mood.
What does an engulfing pattern tell us about the market’s mood?
An engulfing pattern indicates a potential change in market sentiment. It forms when one candle completely engulfs the body of the previous candle, indicating a shift of strength between bulls and bears.
If buyers dominate sellers, it indicates increasing bullish momentum. However, if sellers regain control after a strong rally, it signals that bearish sentiment is strengthening.
However, an engulfing pattern should not be regarded as a reliable indicator of a trend reversal on its own. But its significance increases when it appears after a strong trend and is supported by other technical indicators such as trading volume and key support and resistance levels.
What is a Bullish Engulfing pattern?
A Bullish Engulfing is a two-candle formation that forms after a downtrend. The pattern consists of a small bearish candle followed by a larger bullish candle that completely covers the body of the previous candle.
What it indicates
The pattern indicates that buyers stepped in with stronger force, possibly bringing the downtrend to an end. It shows an increase in confidence among investors and indicates that an uptrend is beginning.
Although the pattern indicates improving market sentiment, traders usually wait for the next session to confirm continued buying pressure. A bullish confirmation candle decreases the possibility of a false signal.
What is a Bearish Engulfing pattern?
The Bearish Engulfing pattern appears after an uptrend. It begins with a bullish candle followed by a larger bearish candle which completely covers the body of the previous candle.
What it indicates
The pattern indicates weakening buying pressure and growing seller control. It usually implies that the current uptrend is getting weaker and prices may fall further if selling continues.
Like any other pattern, the bearish engulfing pattern is also more reliable when combined with indicators such as RSI, MACD, moving averages, and volume analysis to confirm the trend reversal.
How to read the market’s mood using engulfing patterns
The appearance of an engulfing candlestick formation is just the start. Here are some ways to decode them and gauge the market’s overall sentiment.
- Determine the dominant trend: A bullish engulfing pattern after a downtrend implies that buyers are regaining control, whereas a bearish engulfing pattern after an uptrend suggests sellers could take charge.
- Observe candle strength: The larger the engulfing candle, the stronger the buying or selling pressure is, which may indicate a significant change in market sentiment.
- Check the pattern’s location: Engulfing patterns that occur near key support and resistance levels are more meaningful than ones that occur in the middle of a trend.
- Pay attention to the trading volume: A high trading volume during the engulfing candle indicates stronger market participation and therefore a more reliable change in market sentiment.
- Wait for confirmation: Don’t make any moves based on an engulfing pattern alone. Wait for the next candle to confirm that the expected momentum is genuine.
Conclusion
Understanding the market’s mood is as important as monitoring changes in prices. Bullish and Bearish Engulfing patterns can help identify changes in momentum. However, the most effective trading decisions come from combining these signals with a broader understanding of market analysis.
